
The One Minute Logout
How a two-year-old library bug took down our mission-critical Medical-AI app

One Saturday morning, our users started getting logged out of our web app after exactly a minute. Sign in, click around, get bounced to the login page. Sign in again, sixty seconds, back to login.
The complaints coming in were unusually specific about the timing, which is rare for a "the app is broken" report. It also turned out to be the single most useful clue we had. In the meantime, this ran for about five and a half hours and affected several hundred users across our US clinics.
Why a one-minute logout is a bigger deal in our domain
We build software for clinicians. Medical AI, specifically: models and workflows that surface findings during patient visits. In most SaaS, a session that dies early is annoying. In ours, it's a clinician mid-appointment locked out of the tool they were using to explain something to the person sitting in front of them. The appointment happens whether our backend is available or not.
So the parts of our stack that get the most attention aren't the models. They're the auth path, the health checks, the connection pools. The boring parts. On this particular Saturday, all of them failed together.
What we thought it was, and why we were wrong
The first hypothesis was Auth0. "Users can't stay logged in" pattern-matches to identity provider before anything else, and it's usually right. Auth0's status page was green, but status pages lag, so we checked our own auth logs. The token flow looked healthy up to a point, then requests started returning 401. Not because tokens were invalid, but because something else in the request path was.
Second hypothesis: the database. There'd been recent infrastructure work, so someone had plausibly broken a permission somewhere. Cloud SQL metrics: fine. Latency: fine. Service account: canlogin=true, connlimit=-1, unchanged. IAM binding: intact. Everything the app touched at the database layer looked healthy from the database's side.
Forty minutes in, both top hypotheses ruled out. The clue we'd been ignoring was the timing. Exactly sixty seconds. Not "about a minute." Sixty. That kind of precision doesn't come from a distributed system reaching consensus about when to fail. It comes from a single hardcoded number somewhere.
The narrowing
Three observations tightened it fast.
Only our US region was affected. Our EU and CA deployments, running the same code and same connector version on the same Kubernetes flavor, were completely fine.
Only one of our datasources was implicated. Our backend talks to two logical databases through separate connection pools. Requests hitting the analytics pool hung. Requests hitting the other pool returned instantly.
Only the authenticated path was broken. Our public health endpoint was serving pong cheerfully, and Kubernetes thought every pod was healthy.
"One region, one pool, one code path" is what shifted us from "the database is broken" to "our side of the connection is broken." Same connector version everywhere, same IAM everywhere, same code everywhere, but only this pool in this region was collapsing. Whatever the bug was, it lived inside the JVM, not in the shared infrastructure around it.
The break
The signal that broke it open was a SQL error code buried in our logs: SQLState 08003, connection_does_not_exist. That's what the JDBC driver returns when it tries to use a TCP connection that got closed out from under it.
Combined with a pool metric that had drifted to total=0 on every affected pod, the picture snapped into focus. Established connections were being severed. New connections were hanging. Every authenticated request had to go through the auth filter, the auth filter needed a connection from the analytics pool, and with the pool empty each request blocked for the full connection-timeout=60000ms before giving up and returning 401.
That was the one-minute logout. Not a session timeout, not a token expiry. Just every authenticated request waiting the full connection-acquisition timeout, failing, and returning a 401 that the frontend correctly interpreted as "log the user out." Chairside, that meant a clinician mid-explanation to a patient, staring at a spinner, then getting kicked back to the login screen.
Layer one: the trigger conditions
We run on GKE Autopilot. Autopilot enforces hard CPU limits per pod, which has a subtle interaction with JVM libraries that rely on background threads: when the threads run inside a pod that hits its CPU quota, they get throttled. They don't fail, they just don't run until quota frees up. Under the morning load ramp, that's what was happening to our JVM's background threads. (The same pattern applies to any platform that can decide your workload doesn't get CPU right now, not just Autopilot.)
That by itself isn't dangerous. What made it dangerous is what one specific background thread was doing.
Layer two: the library
The pool couldn't refill because creating a new connection was taking about 136 seconds. Our other pool, hitting the same instance, was doing it in under two.
That's slow, but on its own not fatal. HikariCP has a well-known failure mode here: when creation stalls rather than fails, the pool sees a retry as still in flight and doesn't start another one. Under sustained load, the pool never rebuilds. Ours didn't.
136 seconds isn't a number Postgres does. It isn't something a healthy Cloud SQL instance does either. It's what happens when the in-process Cloud SQL connector's background credential-refresh loop gets wedged.
We were on postgres-socket-factory 1.18.0, which was released in 2023. Somewhere between 1.18.0 and 1.28.1, the maintainers shipped a fix with a changelog entry that reads, roughly, "reset the refresh-running flag on terminal exceptions in the refresh-ahead strategy." In older versions, if the background thread that refreshes ephemeral certs and IAM tokens hit a specific kind of failure (say, a transient error from the admin API), the flag that said "a refresh is in progress" never got reset. From that point on, the connector believed a refresh was always underway, so it never started a new one. The app would wait for credentials that no thread was going to fetch, until a JVM restart cleared the state.
We had two connector instances in the JVM, one per datasource. Both were equally exposed, but only the analytics pool's happened to hit that transient failure during the window. Once it did, its refresh loop was stuck; the other's kept running. That's why the same connector version, in the same JVM, produced completely different behavior for two different pools.
The connector's default refresh strategy assumes its background threads can run whenever they need to. Under CPU throttling, they can't. That's the exact failure mode the newer connector versions added a lazy refresh strategy to avoid.
Layer three: the config that turned a stall into a collapse
At this point we had a slow-creation problem, not necessarily an outage problem. A pool that takes 136 seconds to create a connection is bad but recoverable. Eventually the connections show up and the pool refills.
Except we had max-lifetime on the analytics pool set to 120 seconds, which is shorter than the creation time. Once creation slowed down, the pool was retiring connections faster than it could replace them. It couldn't recover on its own. The pool wasn't just slow; it was actively bleeding out.
This is the kind of bug that only appears when two independent things go wrong. max-lifetime=120s is fine as long as creating a connection takes two seconds. A 136-second creation time is bad on its own but survivable. The two together are a guaranteed collapse under load. Nobody made a wrong call in isolation. The composition was wrong.
Layer four: why we were flying blind
The connector logs useful diagnostics about its refresh state: when a refresh starts, when it completes, when it fails, when it retries. Any of those log lines would have pointed at the real problem within minutes.
We saw none of them, because a single line in our logback configuration pinned the connector's logger to WARN:
<logger name="com.google.cloud.sql.core.CoreSocketFactory" level="WARN"/>
The connector's refresh diagnostics all log below WARN. That one line, added long ago to reduce log volume, was the reason a bug the library was practically shouting about stayed completely silent in our observability.
Kubernetes stayed silent for a different reason. Our readiness probe called a static endpoint that returned "pong" from a controller with no database awareness. As far as the platform knew, every pod was healthy, including the ones that had been serving nothing but 60-second timeouts for over an hour. We already had a database-aware health indicator in the codebase, correctly scoped to the analytics pool only, sitting on the management port. Our probes just weren't wired to it.
The full chain
Reading top to bottom, this is what actually had to happen:
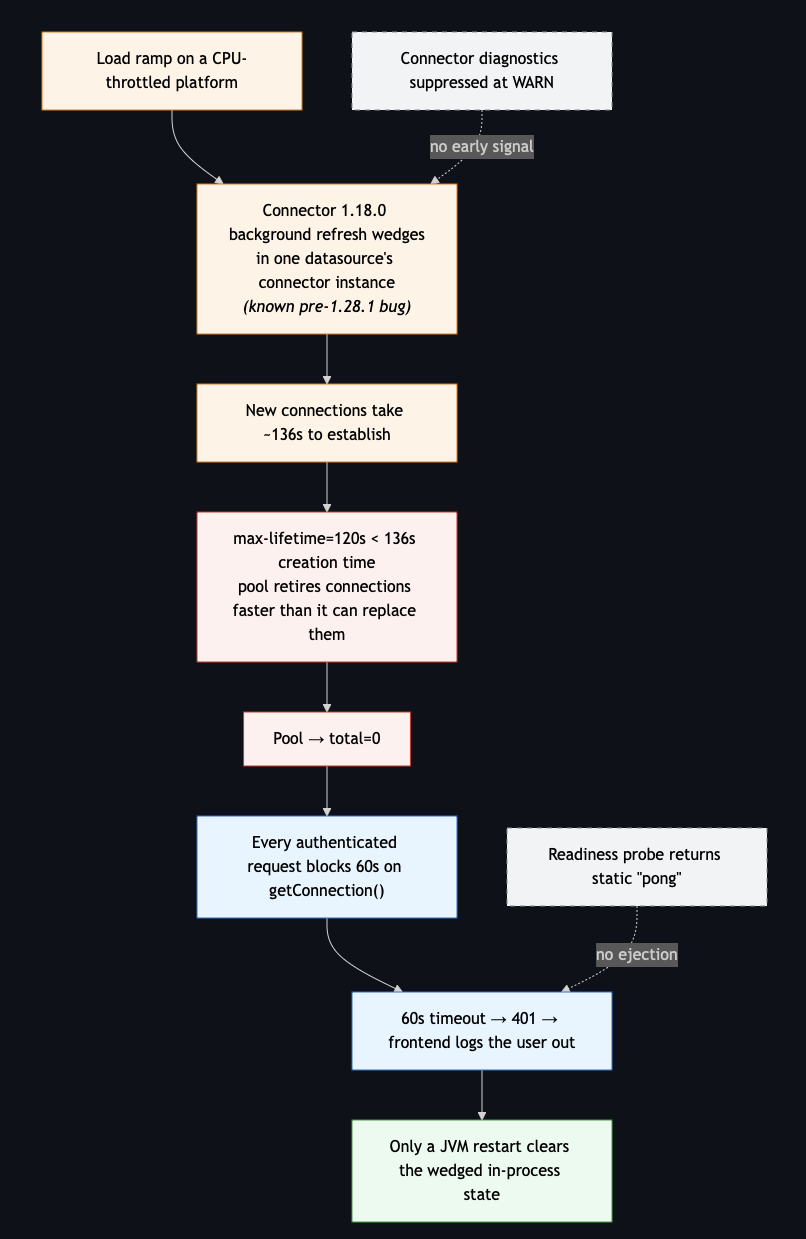
Every link is independently fixable, and every link is also independently reasonable. The connector version was current when we adopted it. The max-lifetime value came from a sensible template. The readiness endpoint is what the platform's own examples show. The log suppression was added to keep noise down. Nobody was careless. The system as composed had a failure mode that none of its parts had in isolation.
The immediate fix was a rolling restart of the affected deployment, which cleared the wedged state inside every JVM. The user-visible outage ended in under three minutes. Roughly five and a half hours to find it, three minutes to fix it once we did.
The real fix, in three layers
We split the durable work into three tickets deliberately: one to remove the cause, one to detect it if it recurs, and one to contain it if we don't detect it in time. We've started structuring post-incident work this way generally.
Remove. Upgrade the connector past the known-bad window. Enable the lazy refresh strategy so throttled background threads can't wedge it. Raise max-lifetime above realistic creation times. Un-suppress the connector's diagnostic logs so we can actually see if it happens again. This shipped first because it neutralizes the specific mechanism.
Detect. Add per-pool metrics and alerts: pending acquisition requests, creation-time percentiles, pool total dropping toward zero. Any one of these, exported and alerted, would have given us a signal minutes before users noticed. We were relying on humans-noticing-humans-complaining as our detection layer for a pool-collapse pattern that has known metric signatures.
Contain. Wire our readiness probe to a health indicator that actually checks the affected pool, on a fast-timing-out query so the probe itself doesn't hang. If the pool wedges again on a single pod, the platform will drop that pod from rotation instead of leaving it to serve 60-second timeouts for hours. Keep liveness narrow: a global database-aware liveness check is a restart-storm foot-gun during a true database outage, so liveness stays as a simple process-alive check.
The upgrade is done. Detection and containment are in progress.
Takeaways
If you skip the rest of this post, here's what to check on your own systems this week:
Does your platform throttle CPU on your workload? GKE Autopilot, Cloud Run, App Engine Standard, and Cloud Functions on GCP; EKS Fargate, Lambda, and hard-limited ECS tasks on AWS; Container Apps, App Service, and Azure Functions on Azure. If yes, any library that relies on background threads for time-critical work is exposed. Cloud SQL's Java, Python, and Go connectors all now ship a "lazy" refresh mode specifically for this pattern.
What version is your database connector? If it's more than a year old, read the changelog between your version and current for anything mentioning "refresh," "stuck," or "hang."
Is your pool's
max-lifetimelonger than the worst-case connection-creation time under load? If not, you have a latent starvation bug regardless of any library bug.Does your readiness probe actually touch the things a request needs? A static
/pingendpoint is not a health check; it's a lie your platform will believe.Are any of your library loggers pinned above INFO? Every logger you've silenced is a class of failure you've decided you don't want to see. Sometimes that's the right call, but it should be an intentional one.
Do you alert on pool metrics? Pending acquisitions, creation-time percentiles, pool total. If not, your detection layer is "users complain."
And one wider thought worth saying out loud: a "known bug in a well-known library" isn't embarrassing. It's the most common cause of production incidents in mature systems. The writeup that names the version, the specific fix, and the trigger condition is the writeup that helps somebody else avoid the same day.
Our connector is upgraded. The next time the pool starts to wedge, our metrics will fire before the users do. If they don't, our readiness probes will pull the bad pod out before those sixty seconds ever start counting.